Partnering with America’s Cultivation Corridor Keeps
Iowa has long been a leader in agriculture and ag innovation. But maintaining this advantage requires continued work to attract companies, talent and capital to keep Iowa No. 1. The work of America’s Cultivation Corridor and its partners like Iowa Corn prioritize this effort.
America’s Cultivation Corridor works to connect global companies, investors and innovators with agricultural businesses, organizations and government agencies based right here in Iowa.
Key Industries and Focus Areas Within America’s Cultivation Corridor
The Corridor works across the following five sectors.
- animal science
- crop genetics
- bioproducts
- food technology
- advanced manufacturing
Iowa Corn is seated alongside partners like Iowa State University, John Deere, Sukup, KENT WORLDWIDE, Corteva, Iowa Pork Producers Association and MidAmerican Energy on the Corridor’s board, ensuring Iowa corn farmers’ priorities are helping shape the future of Iowa’s agricultural economy.
What Is the Mission of America’s Cultivation Corridor?
“When I think about Iowa corn growers, I think about the risks they take every day and the way they have continually adapted through generations to adopt new technologies and innovations. Those advancements have helped drive higher yields, improved sustainability and expanded market opportunities,” shared Billi Hunt, executive director of America’s Cultivation Corridor.
“The Corridor’s purpose is to help align farmers, researchers, innovators and businesses so we can continue advancing agriculture and creating new opportunities for Iowa agriculture and rural communities,” Hunt continues.
Cultivo Virtual Academy Brings Innovation to U.S. Ag
One of the Corridor’s main programs is the Cultivo® Virtual Academy, a program that prepares international companies and entrepreneurs for entry into U.S. agriculture, food or bioscience markets. Participants in the program are connected with Iowa researchers, business leaders and organizations, such as Iowa Corn, to continue discussions specific to their goals for U.S. market entry.
Last year, nine companies from the United Kingdom completed the fifth Cultivo cohort. Participating companies represented a range of innovations relevant to agriculture, including AI-based crop monitoring, robotic weeding technology and plant-based crop stimulation.
How the Corridor Helps Grow New Markets for Iowa
Through the Corridor, Iowa Corn connects with start-ups and international companies interested in Iowa’s agriculture. Many of these interested parties are drawn to Iowa because of the scale and reliability of Iowa agriculture, including corn production.
Building demand for corn doesn’t happen on its own. The visibility with these organizations opens doors to new partners, new technology and new markets for Iowa corn.
“I have had the opportunity to serve as the Iowa Corn representative on the Corridor board for the past two years. Seeing the scope of companies and work that the Corridor connects with is really encouraging as a farmer,” shared Jason Orr, farmer from Buchanan County. “I know that our investment is helping develop the future businesses and technology in our industry that will ultimately benefit my operation and others.”
Iowa Corn is committed to creating long-term opportunities for farmer profitability. Connecting Iowa’s corn farmers to the innovators and investors who will shape agriculture’s next chapter is just one of the ways we do that.
Share This Article
Related Articles
The best way to enhance grower profitability is to create new demand for corn, including the export of grain and value-added grain products. In times like these when corn prices are low, exports have been a bright spot. Industry Partners Help Find International Buyers for Iowa Corn From grains to value-added products like pork and beef, corn grown in Iowa is exported all...
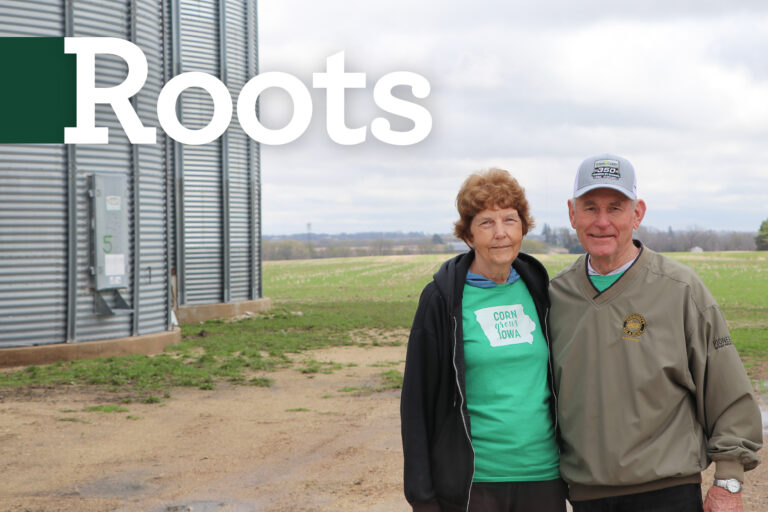
Vic has been an active and engaged Iowa Corn Growers Association member for the past 40 years. Read about his life dedicated to caring for the land.