2024 March Stewardship Advocate
This month’s Stewardship Advocate focuses on Carbon Intensity (CI) scores, including how they are calculated and what farmers can do to improve their scores. CI is defined as carbon dioxide emissions per unit of energy and is recorded as grams of greenhouse gases (GHG) per mega-jewel (MJ). Carbon dioxide makes up the majority of greenhouse gas emissions across all industries, including the agricultural sector. CI scores allow for the quantification and comparison of the emissions associated with producing, distributing, and consuming a product or activity. A higher score indicates a higher carbon footprint while a lower CI score indicates a smaller carbon impact. For corn farmers, carbon intensity can be thought of as the amount of energy that goes into every bushel of corn.
CI scores are calculated using the federally approved GREET model. GREET stands for Greenhouse Gases, Regulated Emissions and Energy Use in Technologies that was developed by the U.S. Department of Energy Argonne National Lab in 1995. GREET is the lifecycle analysis model used to assess the energy impacts associated with all stages of a supply chain. It is also used to calculate the carbon footprint of renewable fuels. The GREET model has evolved over time as more data and information is available to update the model.
A CI score of 0 means the bushel of corn is carbon neutral. The estimated national average CI score for corn is 29.1g GHG/MJ, measured with units specifically for ethanol production. However, estimates of CI scores are lower in states like Iowa and are in the 27-28g GHG/MJ range, primarily because of higher yields produced in the state.
At the farm-level, CI scores account for all upstream and downstream emissions per unit or bushel of output, including the practices and inputs used to produce the crop. The Feedstock Carbon Intensity Calculator (FD-CIC) is a supplement to the GREET model and allows for the calculation of agricultural emissions with different farming practices. Scores are affected by fertilizer and chemical application types and rates, on-farm energy consumption and yield per acre. While each farm and production systems are different, the fertilizer and chemical application types and rates contribute the most to a CI score.
The parameters used in the FD-CIC to calculate CI scores at a farm or field level are shown in Tables 1 and 2 with the outputs of the calculator shown in Table 3. All of these inputs are in the control of corn farmers with the exception of crop yield. For example, let’s compare two neighboring corn farmers who both harvest 200 bushels per acre. Farmer 1 uses no-till with cover crops, manure and a moderate nitrogen rate and will achieve a lower CI score than their neighbor who uses conventional tillage, no cover crops, no manure and applies a higher rate of nitrogen.
CI scores are gaining more attention from farmers and ethanol producers. The impending tax credits will be based on these scores. Knowing how to lower your CI score will become increasingly important for Iowa corn farmers as carbon markets expand and tax credits become available.
Table 1. Feedstock Carbon Intensity Calculator Inputs.
| Parameter | Measurement |
|---|---|
| Crop | Species |
| Yield | Bushels per acre |
| Energy consumed per acre | Diesel, gasoline, natural gas, LP, electricity |
| Nitrogen fertilizer source | Lbs. N per acre |
| Phosphorus fertilizer source | Lbs. P2O5 per acre |
| Potash fertilizer | Lbs. K2O per acre |
| Lime | Lbs. per acre |
| Herbicides | Grams per acre |
| Insecticides | Grams per acre |
Table 2. Management Inputs Used in the Feedstock Carbon Intensity Calculator.
| Parameter | Response |
|---|---|
| Location | State and county |
| Cover crop planted | Yes or no |
| Manure application | Yes or no |
| Tillage used | Conventional, reduced or no-till |
Table 3. Feeding Carbon Intensity Calculator Outputs.
| Outputs from the Feedstock Carbon Intensity Calculator show the amount of greenhouse gases coming from each input. |
Source of Tables 1-3: Department of Energy Argonne National Laboratory
Latest Information
Scientists Say the New Frontier for Corn Research is Found in the Crop’s Roots
New Technology to Increase Carbon and Sunlight Capture in Corn
Fertilizer Relay System Gives Corn a Big Push Out of the Gate
8 Field Activity Data Types You Need to Collect Now
There’s a New Way to Cash in on Your CI Score on the Farm, Thanks to the Inflation Reduction Act
Smart Seed Selection Tool Pledges to Close Yield Gap
Pros and Cons of 7 Tillage Systems
Iowa NRCS Announces May 7 Deadline for Conservation Agreement Proposals
Farmer to Farmer: Stan Nelson

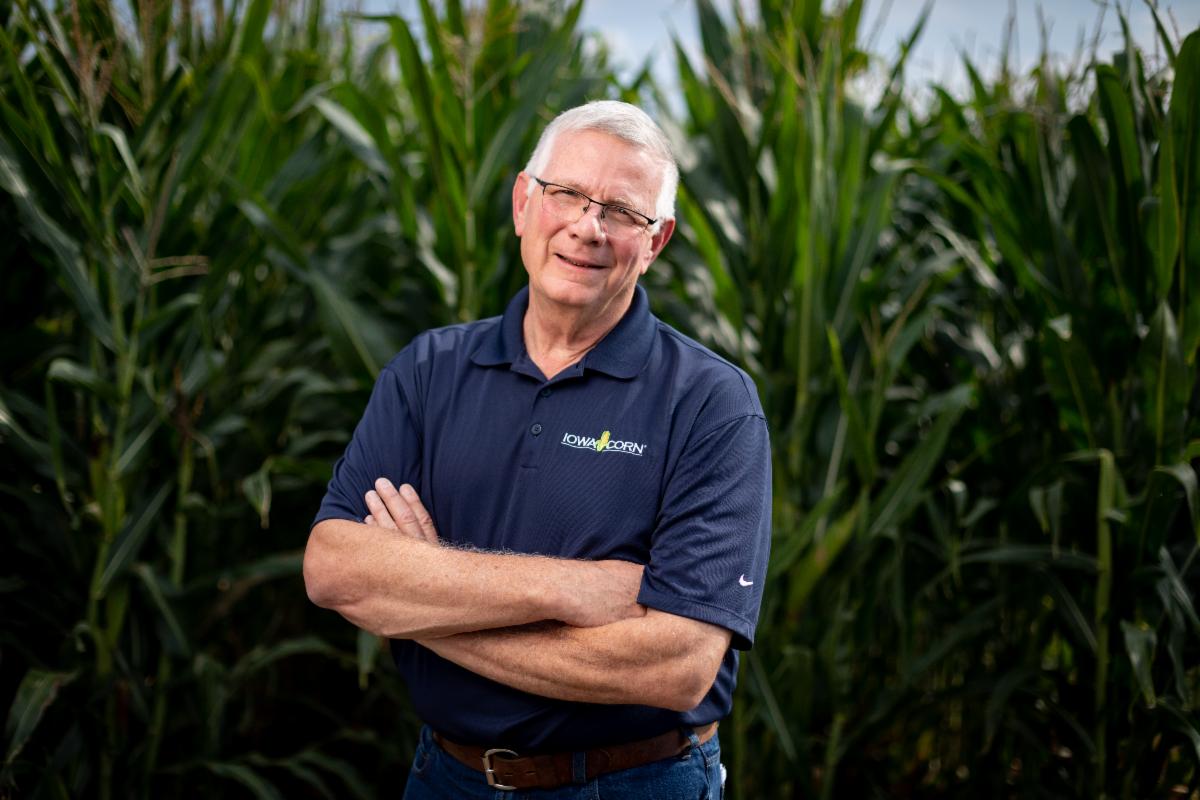
Stan Nelson and his family operate a century farm in Des Moines County near Danville, Iowa. He farms with his wife Martha, and two daughters and their families. Stan has a strong sustainability ethic that motivates him to continually improve the operation economically and environmentally. He is a pioneer in no-till, he shared, “In 1979, my dad was trying no-till with assistance from Iowa State and our local community college. We struggled with soil tilth and weed control. Over time, with no-till, we are seeing improvements in our soil health and organic matter.”
Like all farmers, Stan knows that mother nature controls a lot of yearly outcomes. “We do everything we can to improve our practices and I’m convinced we have mitigated some of the impact of the variable weather that we face every year,” he shared. “Every generation on our century farm has implemented the best practices of the times. I’m continuing that legacy to increase the resiliency of our operation so I can pass it on to the next generation in better shape than I received it.”
Stan has a 50-50 crop rotation and plants his corn in 30” rows and his soybeans in 15” rows. Most of his farms have uniform soil types so he keeps his corn planting rate at 34,000 seeds per acre. Stan notes, “Seed companies are rapidly advancing hybrids and varieties, so I keep a close relationship with my seed dealer and follow the dealer’s advice on variety placement and population. My on-farm trials have confirmed their recommendations for both corn and soybeans. The proof is in the pudding. Despite the below average rainfall in 2023, my corn yields were 5-10% above our APH levels.”
The Nelsons have been soil testing on management zones for about 15 years and monitor the test results and recommendations to inform their fertility program. A vertical tillage pass in the spring following fall applied NH3 with a nitrification inhibitor has been the pattern for corn but Stan used strip-till for the first-time last fall. Stan implements the 4Rs of nutrient stewardship by applying the right type of nutrients at the right rate and right time and in the right place.
In addition to no-till and strip-till, the Nelsons also plant cover crops ahead of soybeans. “We’ve been planting cereal rye into corn stalks for several years and we like to plant soybeans while the cover crop is still green.” Stan is seeing the fruits of his decision to plant cover crops and no-till, saying, “Having healthy soils has improved my water holding capacity, organic matter and soil tilth and that has allowed us to survive longer stretches of dry weather. The improved genetics from seed companies going into healthy soil has increased the production and reliability of our corn crops.”
Off the farm, Stan is also very active in Iowa Corn. “I’m humbled to be serving as President of the Iowa Corn Promotion Board,” shared Stan. “Our production agriculture sector is changing rapidly for the good. We are producing more on fewer acres with less inputs. Everyone up and down the value chain, our legislators and ultimately our final consumers need to be reminded of our regenerative, sustainable production farms. We need a big voice to get the message out and Iowa Corn is that voice. We also need to continue to pursue new markets and uses.”
Upcoming Events
Various Days in April: Iowa Learning Farms Webinars – Webinar
April 5: Conservation Connections Webinar: Cover Crops – Webinar
April 10: Focus on the Future Webinar Series – Webinar
April 18: LIVE Monarch Larva Monitoring Project: Northern US– Webinar
April 18-19: Soil Health and In-Field Practices; Water Quality and Edge-of-Field Practices – Webinar
